Monitoring Docker, OpenShift and Kubernetes - Version 5.1 (Network metrics and socket tables, prometheus autodiscovery)
September 17, 2018We are bringing network metrics and socket tables with minor update Monitoring Docker, OpenShift and Kubernetes Version 5.1. This release also includes visual and usability improvements in application, performance and stability improvements in collector, and new configurations to dynamically discover metrics from Pods, exported in Prometheus format.
Network Metrics
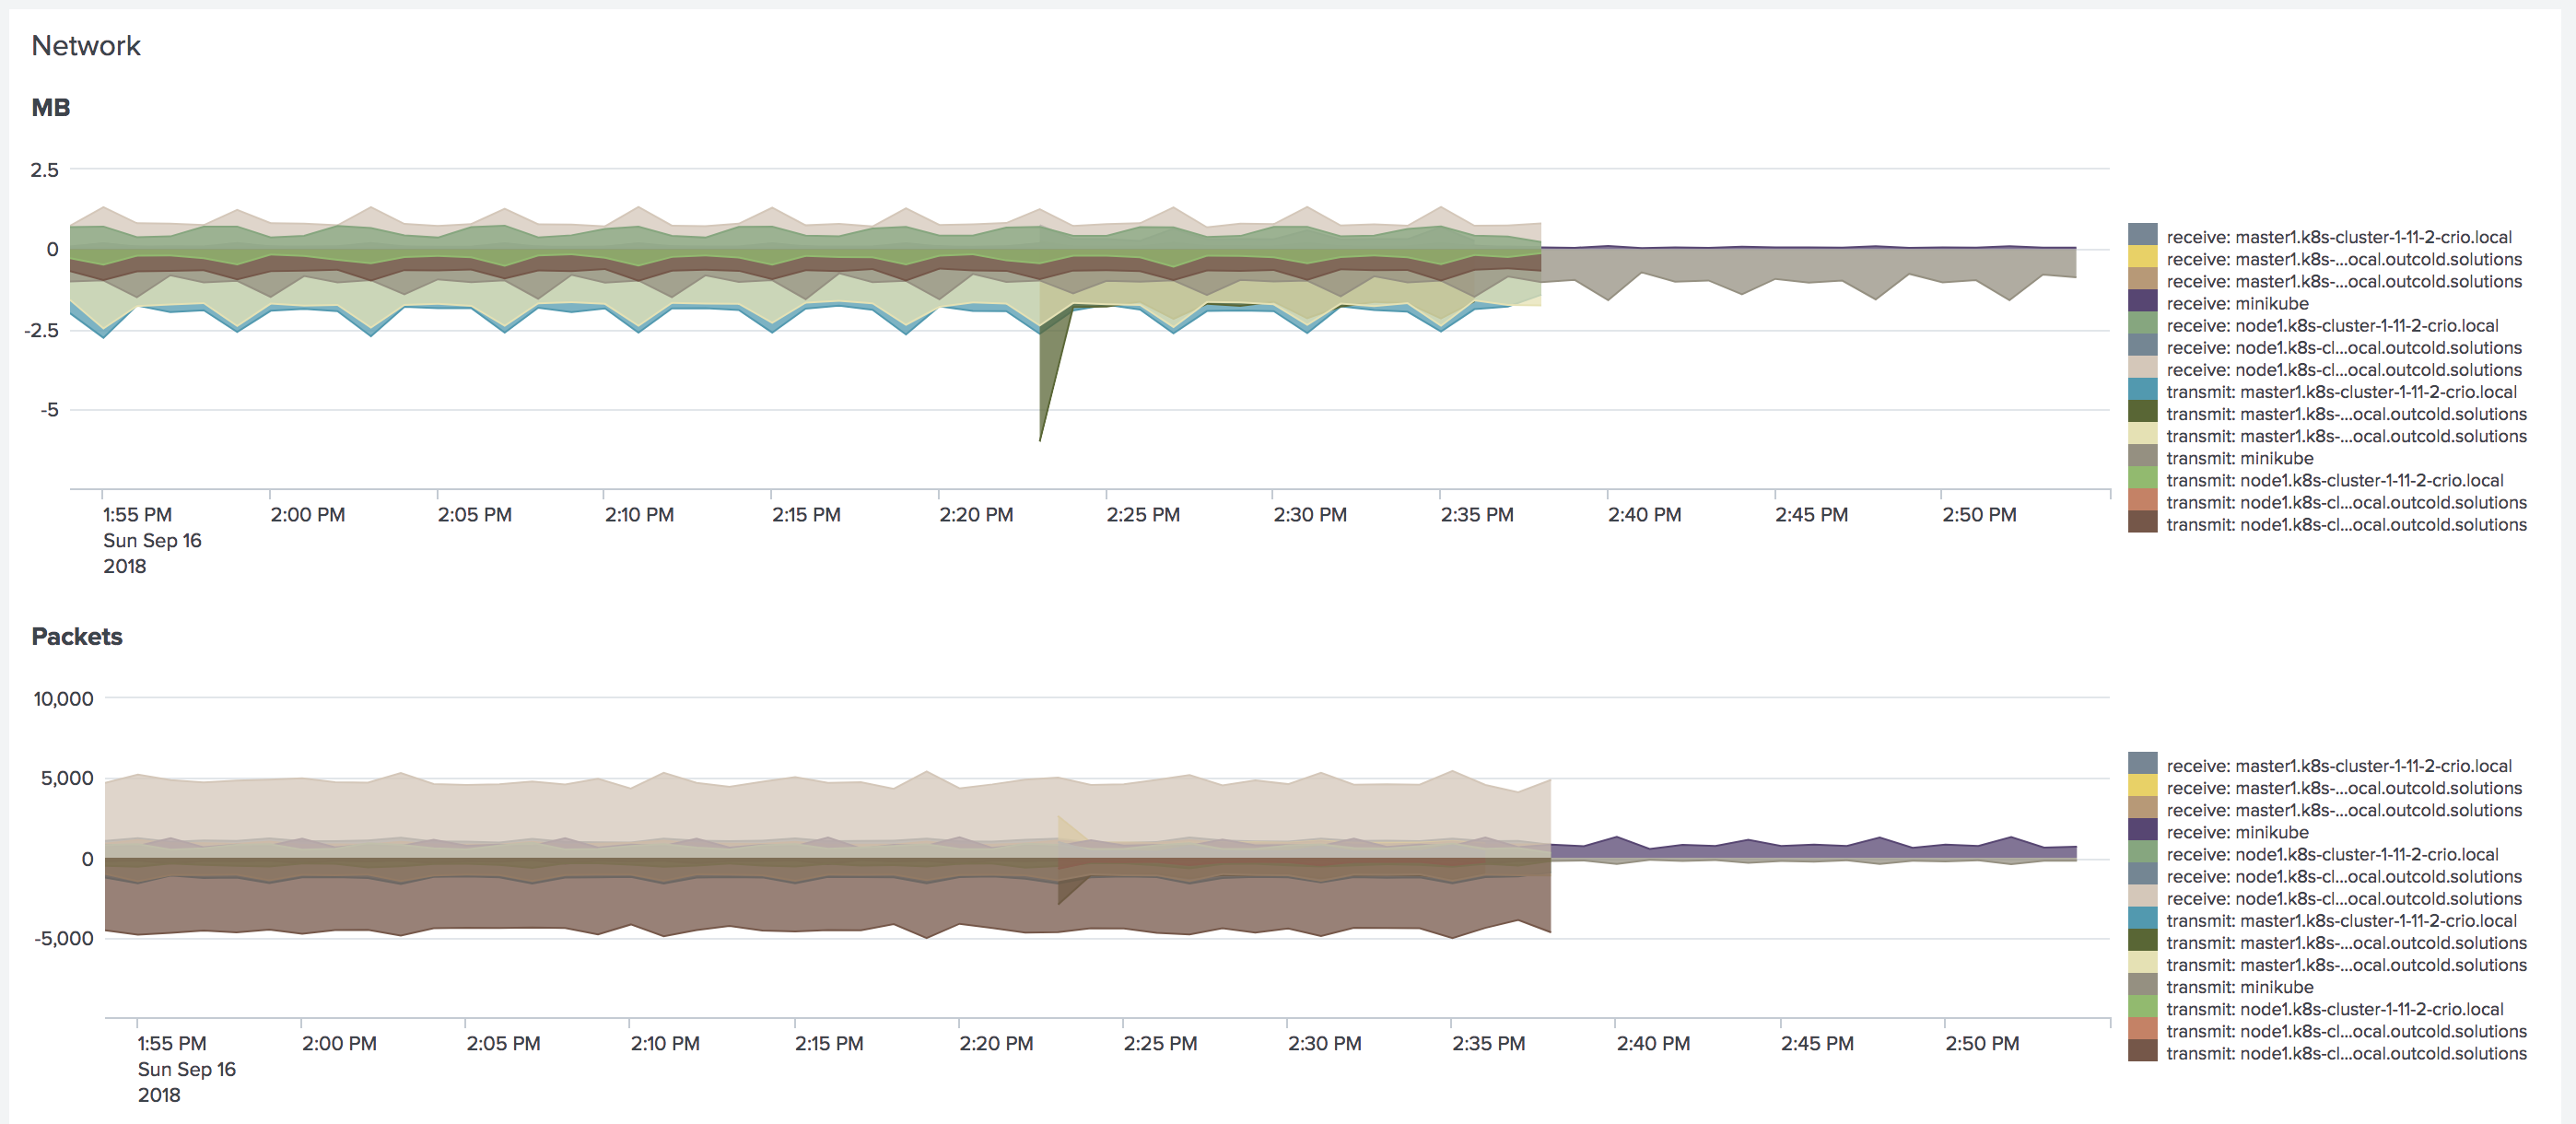
Dashboards for Hosts, Host, Pods, Containers and Workloads includes network metrics: received and transmitted MB, Packets, Errors and Drops.

Network socket table
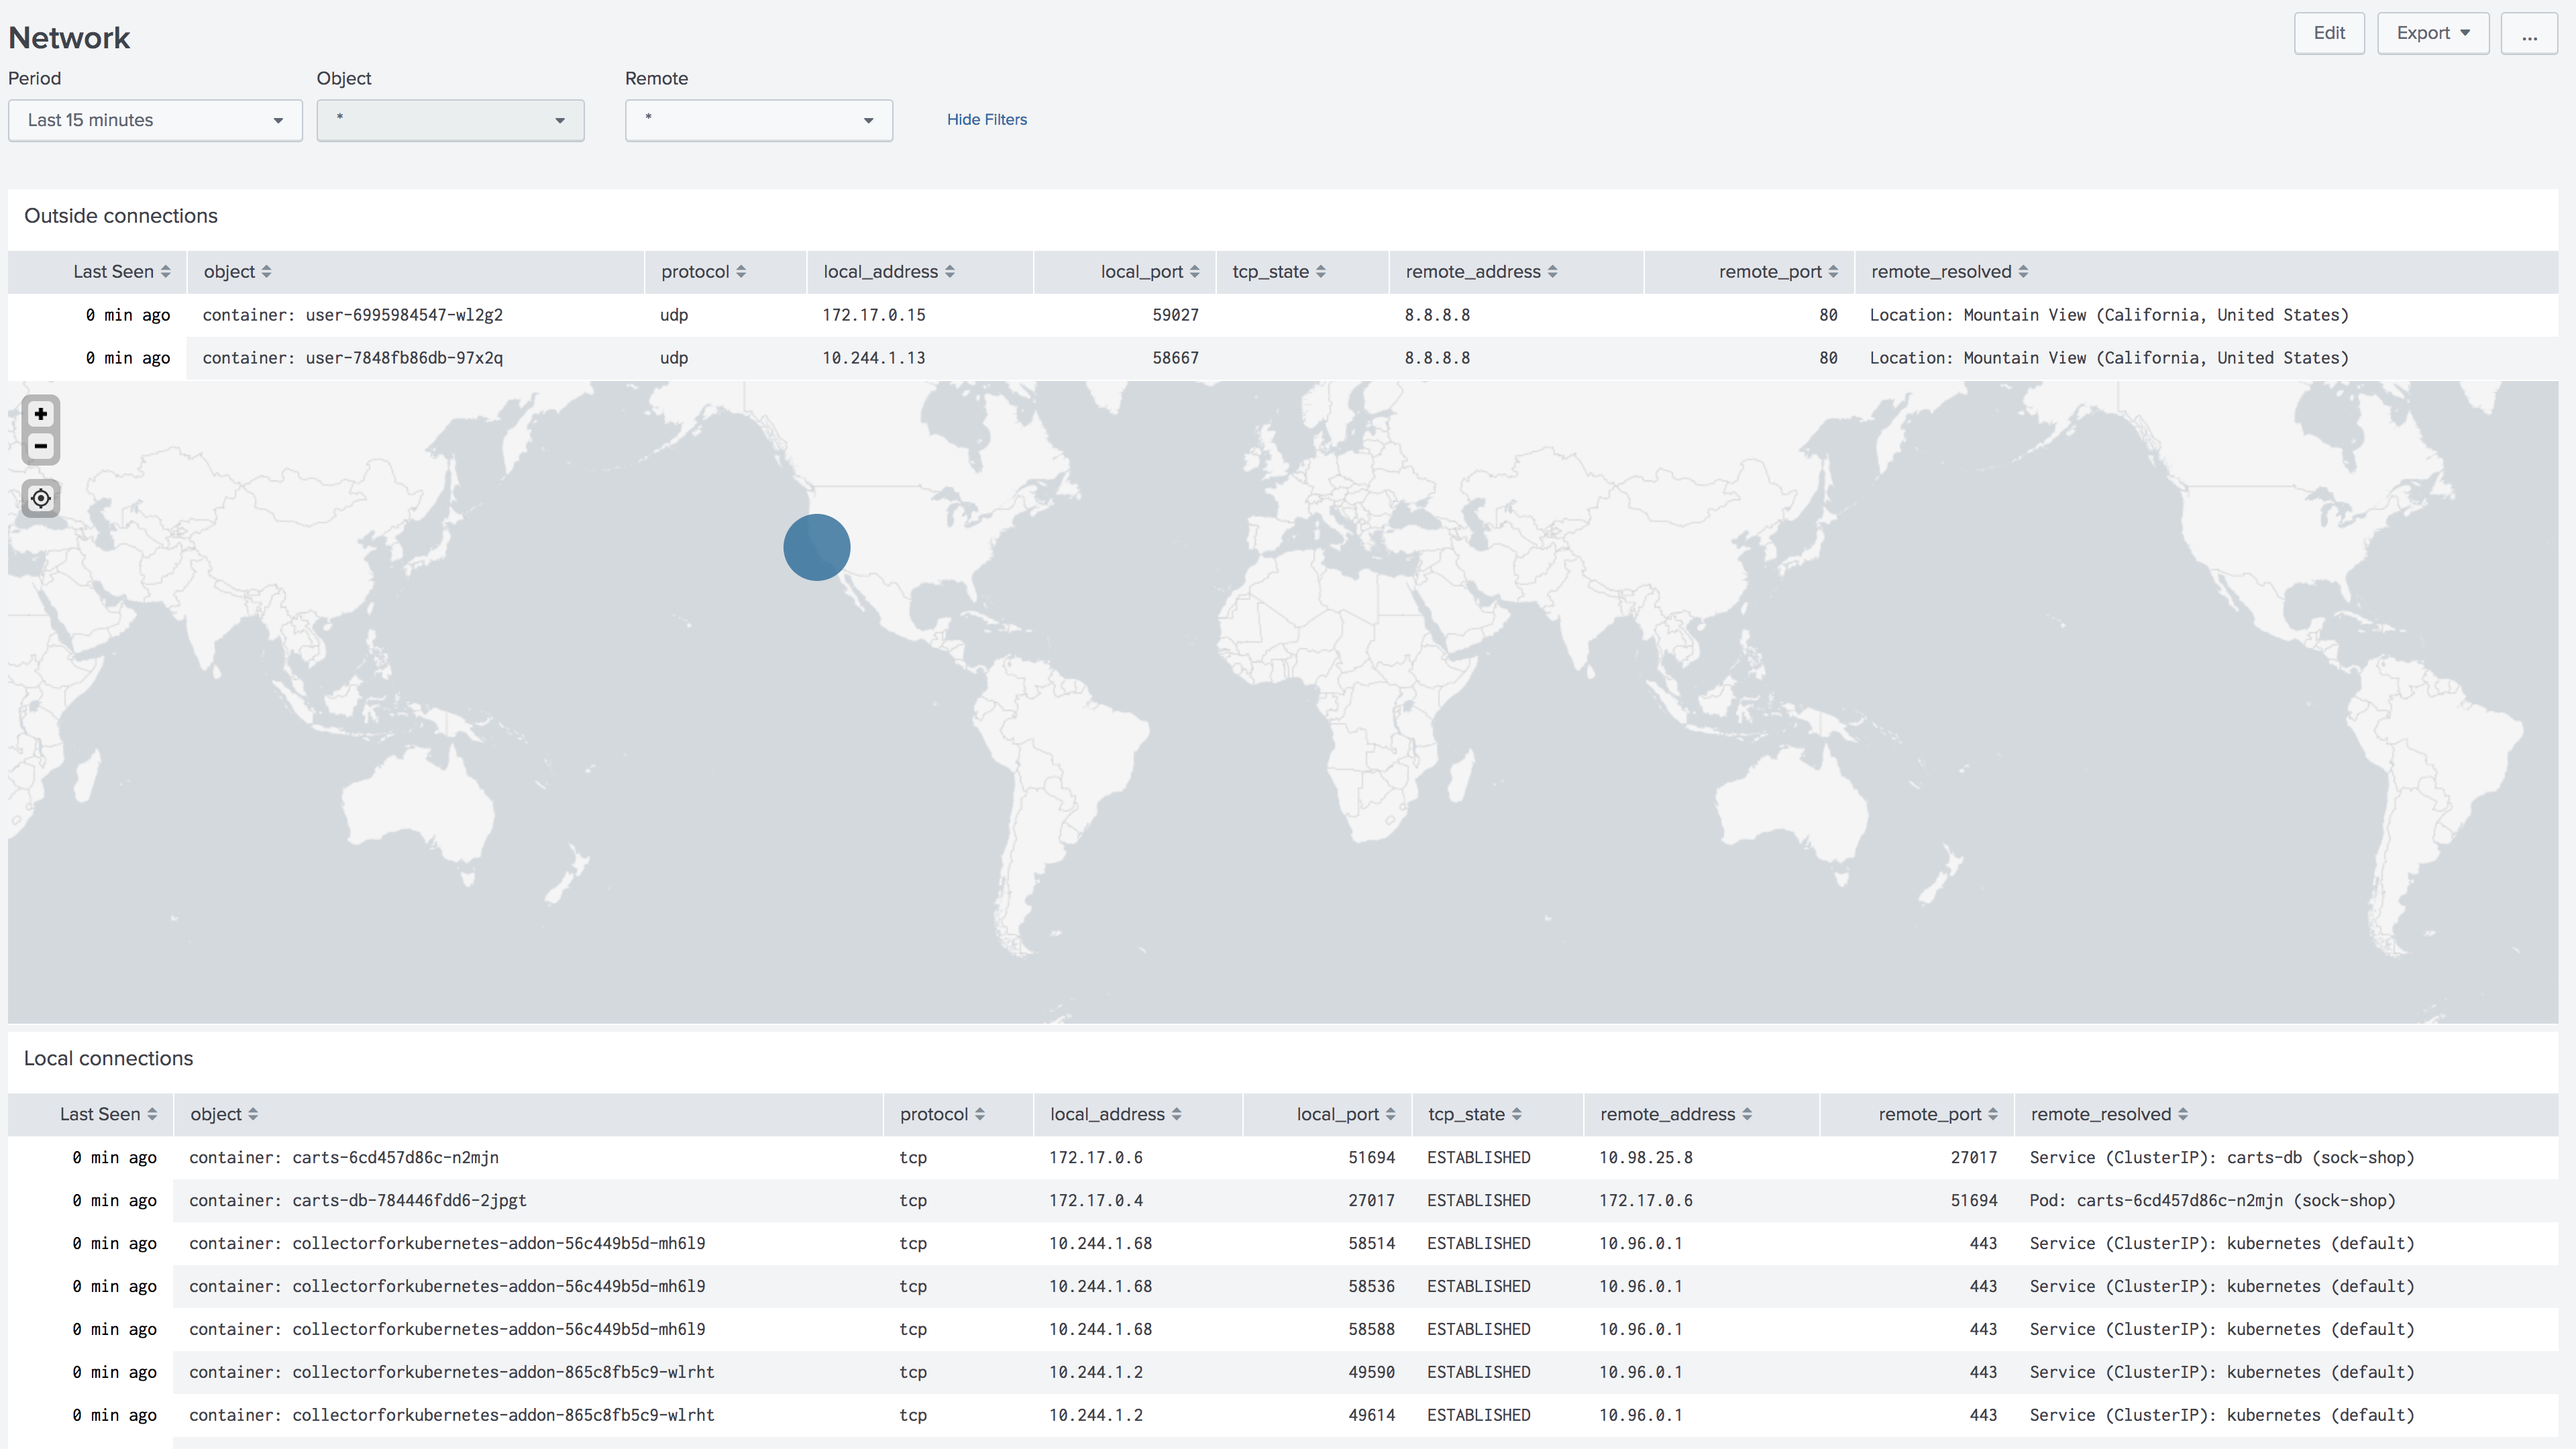
Just network metrics do not give you a lot of visibility of how your containers communicate with each other or public network. Version 5.1 brings network socket tables, which can give you information about current connection established with the Host, Pod or Container, and list of the ports current container is listening on.

Network Review
Network socket tables allowed us to bring another security review dashboard, that allows you to find all the connection to outside world, or between the containers, pods, hosts or services.

Forwarding Prometheus metrics from Pods
We are expanding annotations with support for collecting Prometheus metrics directly from the pods. If your Pod or container can export metrics in Prometheus format, and you want to see these metrics in Splunk, you can simple annotate them, and collector automatically will forward these metrics in Splunk.
1 2 3 4 5 6 7 8 9 10 11 | apiVersion: v1 kind: Pod metadata: name: nginx-pod annotations: collectord.io/prometheus.1-port: '9527' collectord.io/prometheus.1-path: '/metrics' spec: containers: - name: nginx image: sophos/nginx-prometheus-metrics |
To learn more about annotations, and forwarding Prometheus metrics from Pods, please read our documentation
- Monitoring OpenShift - Forwarding Prometheus metrics
- Monitoring Kubernetes - Forwarding Prometheus metrics
Links
Upgrade instructions
Release notes
- Monitoring OpenShift - Release notes
- Monitoring Kubernetes - Release notes
- Monitoring Docker - Release notes


